10-year Treasury yield rises to 5.17% on PPI data
 ITF Team2 min read
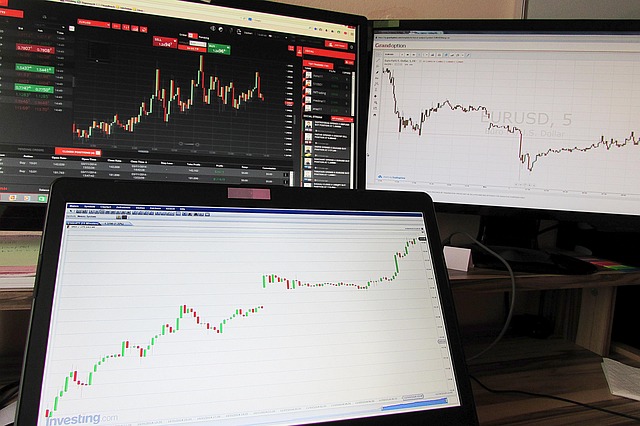
The 10‑year Treasury yield hit 5.17% on 11/13/2026 after October's producer price index missed forecasts, boosting odds of a Fed hike in December.
Key takeaways
- The 10‑year Treasury yield climbed to a high of 5.174% on 11/13/2026.
- October's producer price index rose 0.3% month‑over‑month, below the 0.4% consensus.
- CME FedWatch shows 100% probability of a rate hike at the Dec. 9 meeting.
- Core PPI increased 0.5% in October, the strongest monthly rise since November 2022.
On 13 Nov 2026 the benchmark 10‑year U.S. Treasury yield moved above 5% after the October producer price index (PPI) came in slightly weaker than expected. The yield rose 4 basis points to 5.143% and peaked at 5.174% during the session, reinforcing market expectations of a Federal Reserve rate increase in December.
PPI data and the yield reaction
October’s PPI showed a 0.3% rise from September, missing the 0.4% forecast of economists surveyed by Dow Jones. On a 12‑month basis the index was up 6.5%, the largest annual gain since November 2022. The softer month‑over‑month number still signalled persistent inflation, prompting traders to price in a higher probability of a Fed hike.
Chris Rupkey, chief economist at FWDBONDS, noted that core PPI – which strips out food, energy and trade services – jumped 0.5% in October, the strongest monthly increase in the series. He warned that rising factory‑gate prices often feed through to consumer prices, keeping inflation pressures alive.
Implications for short‑ and long‑dated Treasuries
While the 10‑year yield edged higher, the 2‑year Treasury note slipped marginally to 4.859%, down less than 1 basis point. The 30‑year bond, more sensitive to geopolitical risk, rose over 4 basis points to 5.472%. The divergent moves reflect the market’s focus on near‑term Fed policy for the 2‑year and on broader risk sentiment for the longer end.
Investors interpret the 10‑year rise as a reaction to the growing certainty of a rate hike at the Fed’s Dec. 9 meeting. CME Group’s FedWatch tool now shows a 100% probability of a hike, with an 89% chance of a 0.25‑point increase and a 14% chance of a 0.50‑point move.
Read also: Gold pares gains as mixed US PPI fuels Fed tightening fears
Energy prices and the inflation backdrop
Oil prices added nuance to the inflation picture. West Texas Intermediate for December delivery fell 0.2% to $88.56 per barrel, while Brent edged up 0.02% to $95.84. The mixed move follows easing concerns over a potential U.S. strike against Iran, reducing the risk of a sharp oil‑price shock.
Because energy costs feed directly into the PPI, the modest decline in WTI helped keep the headline PPI below expectations, even as core components remained robust. Traders will watch upcoming CPI releases and any further developments in the Middle East for clues on future yield trajectories.
What to watch next
Key data points to monitor include the November consumer price index (CPI) due later this month, which will test whether the Fed’s inflation narrative is holding. Additionally, any surprise in oil inventories or geopolitical events could shift the 30‑year yield, which remains sensitive to risk sentiment.
- Next Fed meeting: Dec. 9, 2026
- Upcoming CPI release: mid‑Nov 2026
- Potential oil price swing from Middle‑East developments
Frequently asked questions
Why did the 10‑year Treasury yield rise after the PPI report?
The October PPI showed a 0.3% month‑over‑month increase, slightly below forecasts but still indicating strong inflation. The data reinforced expectations of a Fed rate hike in December, pushing the 10‑year yield up to a high of 5.174% on 13 Nov 2026.
What does the FedWatch tool indicate about the December rate decision?
CME Group’s FedWatch tool shows a 100% probability of a rate increase at the Dec. 9 meeting, with an 89% chance of a 0.25‑point hike and a 14% chance of a 0.50‑point hike, reflecting market consensus after the PPI release.
Official data sources
Related news
- Gold pares gains as mixed US PPI fuels Fed tightening fears
- Silver deficit and higher yields shape market overview
- Pound falls towards 1.32 as Fed hawks outweigh UK growth
- Usd index hits fresh year‑to‑date high in market overview
More from ITF
- ITF trading signals for gold and forex
- Copy verified traders with ITF Copy Trading
- This week’s economic calendar
This article is compiled from international market news for information only. It is not investment advice.