Gold falls below $4,150 as Fed rate‑hike bets rise
 ITF Team3 min read
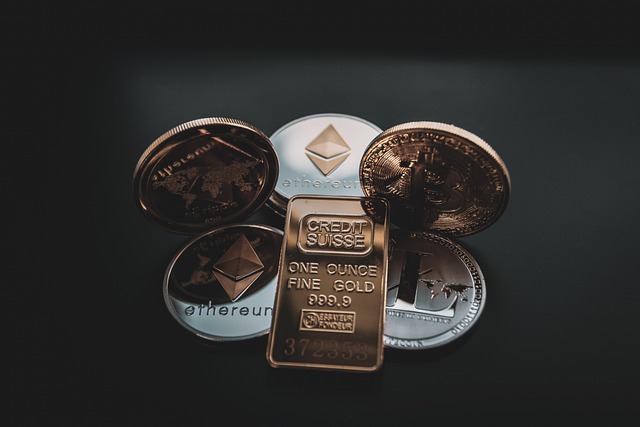
Gold slipped to around $4,125 on 11/10/2026 as stronger US jobs data lifted Fed‑rate‑hike odds to 84%, outweighing hopes from the US‑Iran peace talks.
Key takeaways
- Gold fell to near $4,125 in early Asian trade on 11/10/2026.
- CME FedWatch showed an 84.0% probability of a Fed hike in December, up from 72.8% after the jobs report.
- US non‑farm payrolls added 165,000 jobs in October, well above the 65,000 forecast.
- The 100‑day SMA at $4,200 acts as immediate resistance, while the Bollinger middle band near $4,065 provides support.
Gold slipped below the $4,150 mark, trading around $4,125 in early Asian hours on Tuesday, 11/10/2026. The move was driven by a surge in expectations that the Federal Reserve will raise rates again in December after a surprisingly strong US non‑farm payrolls report. The decline came despite lingering optimism that a US‑Iran peace deal could support risk‑off assets.
Jobs data fuels higher Fed‑hike probability
The US added 165,000 jobs in October, far exceeding the 65,000 consensus estimate and pushing the unemployment rate down to 4.1%. The robust payrolls figure reinforced the view that the Fed may keep policy tighter for longer. According to the CME FedWatch tool, the probability of a December rate hike rose to 84.0% from 72.8% before the data release.
Higher expected rates increase the opportunity cost of holding non‑yielding gold, prompting investors to shift toward dollar‑denominated assets. As the dollar strengthens, gold, which is priced in USD, typically loses ground. The market’s reaction was swift, with XAU/USD slipping below the $4,150 psychological barrier and finding a foothold near $4,125.
Geopolitical backdrop and oil price dynamics
Traders also kept an eye on the evolving US‑Iran negotiations. While a potential peace deal could have bolstered safe‑haven demand for gold, President Donald Trump’s comments downplaying the risk of renewed strikes in the Strait of Hormuz muted that effect. Crude oil prices fell sharply, easing inflation concerns and limiting the downside pressure on gold.
Deutsche Bank noted that broader risk‑off sentiment from an AI‑driven equity sell‑off helped gold post a +5.06% weekly gain – its best week since August – even as Treasury yields rose modestly. The 10‑year US Treasury yield was up 1 basis point at 4.87%, while Brent crude slipped about 1%.
Read also: US CPI forecast for October 2026 and market outlook
Technical picture: gold under the 100‑day SMA
On the daily chart, spot gold remains below the 100‑day simple moving average (SMA) at roughly $4,200, yet it stays above the 20‑day Bollinger middle band around $4,065. The Relative Strength Index (RSI) sits near 52, indicating limited bullish momentum.
The immediate resistance zone is the 100‑day SMA at $4,200, with a stronger ceiling at the upper Bollinger band near $4,225. A daily close above this cluster would be required to reopen a path toward higher highs. On the downside, the Bollinger middle band at $4,065 offers the first line of defense, while a break toward the lower Bollinger band around $3,900 could trigger a deeper corrective move toward earlier cycle lows.
Implications for traders and outlook
The higher probability of a Fed hike puts pressure on gold’s safe‑haven appeal, especially as the US dollar gains momentum. However, the still‑elevated oil price volatility and the uncertain outcome of the US‑Iran talks mean that risk‑off flows could re‑emerge, providing intermittent support for the metal.
Traders should watch the upcoming US CPI release, scheduled for later this week, for fresh clues on inflation trends and the Fed’s policy path. A softer CPI could revive expectations of a more dovish stance, potentially lifting gold. Conversely, a sticky‑inflation reading would likely keep rate‑hike odds high and keep gold under pressure.
- Key level: $4,200 – 100‑day SMA resistance
- Support: $4,065 – Bollinger middle band
- Next data: US CPI (Nov 2026)
- FedWatch probability of Dec hike: 84.0%
Frequently asked questions
Why did gold drop despite hopes of a US‑Iran peace deal?
The drop was mainly caused by a surge in expectations of a December Fed rate hike after the US added 165,000 jobs in October. Higher‑rate odds raise the cost of holding non‑yielding gold, outweighing any safe‑haven boost from the peace‑talks.
What technical level could trigger a further decline in gold?
If spot gold breaks below the Bollinger middle band around $4,065, the next barrier is the lower Bollinger band near $3,900. A breach of that level would suggest a deeper corrective phase toward earlier cycle lows.
How does the US jobs report affect gold’s relationship with the dollar?
Stronger jobs data strengthens the case for higher US rates, which typically lift the dollar. Since gold is priced in dollars, a stronger dollar makes gold relatively more expensive for holders of other currencies, pressuring the metal lower.
Official data sources
Related news
- US CPI forecast for October 2026 and market outlook
- DXY flatlines near 101.70 as traders await US CPI and Iran talks
- Silver XAG/USD correction nears potential turning point
- US CPI October 2026 preview: monthly core pace expected to ease
More from ITF
- ITF trading signals for gold and forex
- Copy verified traders with ITF Copy Trading
- This week’s economic calendar
This article is compiled from international market news for information only. It is not investment advice.