Gold holds steady near $3,850 ahead of FOMC minutes
 ITF Team2 min read
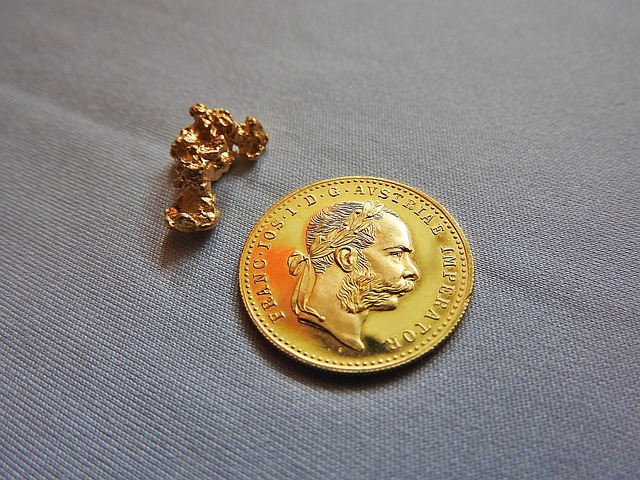
Gold steadied around $3,850 on 11/17/2026 as the dollar stayed near a 19‑month high and Treasury yields rose, with traders eyeing Fed minutes for rate‑path clues.
Key takeaways
- Gold held around $3,850 in early Asian trading on 11/17/2026.
- The US dollar stayed near its 19‑month high despite a slight decline.
- 10‑year Treasury yields rose as markets priced a 95.7% chance of a 25‑bp Fed hike in December.
- CME FedWatch shows only a 4.3% probability of a 50‑bp hike in December.
Gold (XAU/USD) steadied near $3,850 in the early Asian session on 11/17/2026, after sliding to a one‑year low the day before. The metal remains on the defensive as a strong US dollar and higher Treasury yields continue to pressure bullion.
Why the dollar and yields matter for gold
Gold is priced in dollars, so any appreciation of the greenback makes the metal more expensive for holders of other currencies. On 11/17, the dollar lingered close to its highest level in 19 months, even as it gave up a few points. At the same time, benchmark 10‑year Treasury yields rose on expectations that the Federal Reserve will keep tightening policy.
Higher yields raise the opportunity cost of holding a non‑interest‑bearing asset like gold, prompting investors to shift toward yield‑bearing securities. This dynamic helped push gold down to its low in the previous session and kept it capped near $3,850.
Fed rate‑path expectations after recent speeches
Federal Reserve officials have signaled a continued hawkish stance. St. Louis Fed President Alberto Musalem advocated for multiple rate hikes in the coming months, while Cleveland Fed President Beth Hammack said she prefers modest, steady increases but would not rule out larger moves if inflation resurges.
The CME FedWatch tool now reflects a 95.7% probability of a 25‑basis‑point hike in December, with only a 4.3% chance of a 50‑basis‑point move. Such expectations reinforce a strong dollar and keep real yields elevated, both of which are headwinds for gold.
Read also: Bitcoin and gold fall ahead of Fed minutes
Technical picture: price under the 100‑day SMA
On the daily chart, spot gold stays below its 100‑day simple moving average (SMA) and the middle band of the 20‑period Bollinger Bands, indicating bearish bias. The Relative Strength Index sits at 36.6, just above oversold territory, suggesting limited upside momentum.
Key resistance levels sit at the 20‑period SMA around $3,995 and the upper Bollinger band near $4,180, while immediate support is found at the lower Bollinger band around $3,815. A break below that support could open a deeper slide toward the $3,700‑$3,750 range.
What traders should watch next
The main catalyst this week is the release of the Fed’s October meeting minutes later on 11/17. Traders will look for language on the size and timing of future hikes, which could move the dollar and yields sharply.
Other data to monitor include US inflation reports and any geopolitical developments that could revive safe‑haven demand for gold. A sudden easing of dollar pressure or a pull‑back in yields would be needed for a decisive bounce above $4,000.
- 11/17/2026 – Gold steadies near $3,850; USD near 19‑month high
- 10‑year Treasury yields climb as Fed hike odds rise to 95.7%
- Key technical support at $3,815; resistance at $3,995 and $4,180
- Fed minutes due later on 11/17, likely to shape next week’s price action
Frequently asked questions
Why did gold fall to a one‑year low before stabilising at $3,850?
Gold dropped to a one‑year low because a strong US dollar and rising 10‑year Treasury yields increased the opportunity cost of holding a non‑interest‑bearing asset, prompting a sell‑off that was later tempered as the market awaited Fed minutes.
How do Fed officials’ recent comments affect gold’s outlook?
Comments from St. Louis Fed President Alberto Musalem and Cleveland Fed President Beth Hammack suggest further rate hikes are possible, keeping real yields high and supporting a strong dollar, which together act as a headwind for gold.
What technical levels are important for gold traders right now?
Traders watch the lower Bollinger band at $3,815 as immediate support; a break below could lead to a slide toward $3,700. Resistance lies at the 20‑period SMA near $3,995 and the upper Bollinger band around $4,180.
Official data sources
Related news
- Bitcoin and gold fall ahead of Fed minutes
- Gold tumbles below $3,800 as Fed rate‑hike bets rise
- Market overview: Bitcoin slides as gold hits one‑year low, CHF falls on policy split
- Gold falls as strong dollar and hawkish Fed outlook spark fresh selling
More from ITF
- ITF trading signals for gold and forex
- Copy verified traders with ITF Copy Trading
- This week’s economic calendar
This article is compiled from international market news for information only. It is not investment advice.