Gold spikes above $4,050 after Democrats win Congress
 ITF Team2 min read
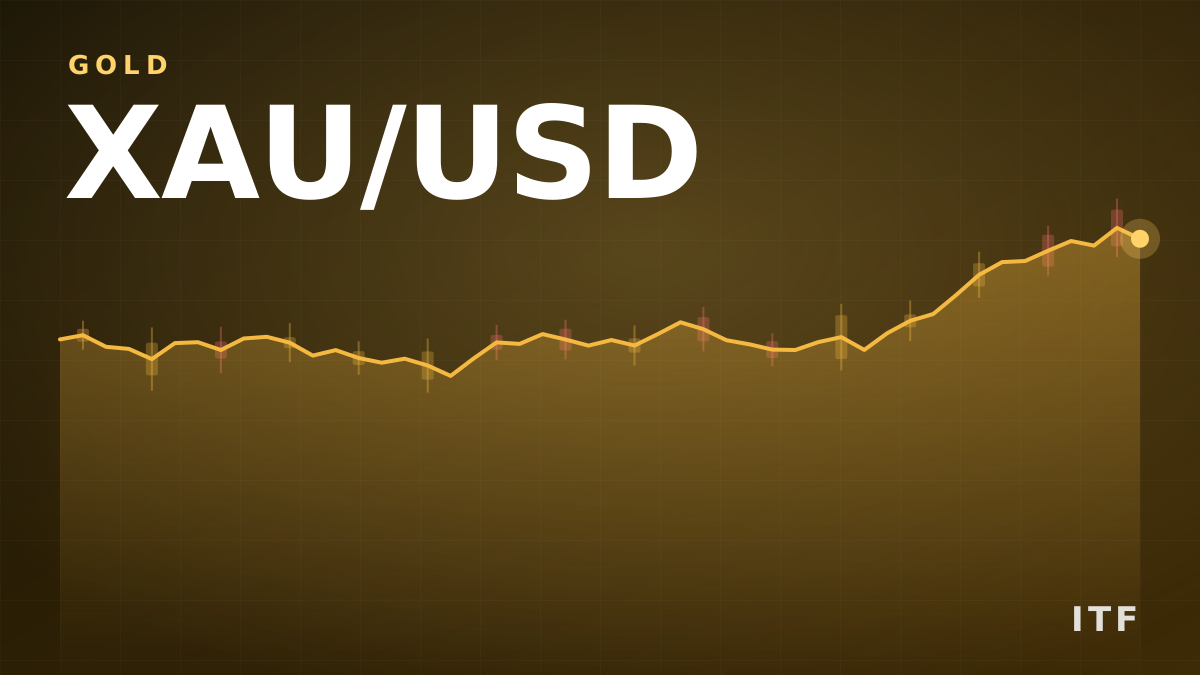
Gold jumped over 3.6% to near $4,065 on Nov 4, 2026, as Democrats seized control of the U.S. Senate and House, pushing the dollar to a one‑month low.
Key takeaways
- Gold rose more than 3.60% to around $4,065 on 11/4/2026, the biggest daily gain since mid‑August.
- Democrats captured both chambers of Congress on 11/3/2026, prompting the dollar to slip to a one‑month low.
- CME FedWatch shows an 82.7% probability of a Fed rate hike in December 2026.
- Spot gold remains below the 20‑day and 100‑day SMAs, with resistance near $4,075 and support around $3,900.
Gold surged past $4,050 on Friday, November 4, 2026, climbing to roughly $4,065 in the early Asian session. The metal logged a 3.60% gain, the strongest move since mid‑August, after the Democratic Party swept the U.S. midterm elections and took control of both the Senate and the House of Representatives.
The political shift was immediately reflected in currency markets. The U.S. dollar slipped below the 105‑level, touching a one‑month low on Wednesday, November 3. A weaker dollar makes dollar‑priced bullion cheaper for overseas buyers, providing the primary catalyst for the gold rally.
How the election outcome moved the dollar and gold
Traders view a Democratic‑controlled Congress as a source of fiscal gridlock that could curb further expansionary spending. That expectation dampened confidence in the dollar, which traditionally benefits from a clear fiscal trajectory and higher‑growth outlook.
At the same time, inflationary pressures remain evident and oil prices stay elevated, giving the Federal Reserve room to keep rates high. Higher rates raise the opportunity cost of holding non‑yielding gold, but the dollar’s decline outweighed that factor in the short run, allowing gold to break back above the psychologically important $4,000/oz barrier.
Technical picture: bullish bounce within a bearish framework
On the daily chart, spot gold is still below the 20‑day simple moving average (SMA) and the 100‑day SMA, indicating a near‑term bearish bias. The Relative Strength Index (RSI) sits near 48, suggesting neutral momentum rather than an oversold condition.
Resistance is clustered around the 20‑day Bollinger Band middle line at about $4,075, the 100‑day SMA at $4,205, and the upper Bollinger Band near $4,255. On the downside, the lower Bollinger Band around $3,900 marks the next key support level; a break below could open a deeper corrective leg, while holding above would keep the market in a broad consolidation zone.
Read also: Market overview: gold spikes, pound tops Brexit level, stocks wobble after US midterms
Broader market context and upcoming data
The gold rally coincides with a broader softening of risk assets. The Australian dollar rebounded from a 12‑day low, climbing above 0.7000 against the U.S. dollar, while USD/JPY edged lower but remained within its 50‑day and 200‑day SMAs. These moves reflect the same dollar weakness that is fueling gold’s advance.
Traders will watch the U.S. September employment report, due on Friday, November 5, for clues on the Fed’s rate outlook. The CME FedWatch tool currently assigns an 82.7% probability to a December 2026 rate hike, a level that could shift sharply if payroll data surprise to the upside or downside.
What to monitor next
Key levels to watch are $4,075 (near‑term resistance), $4,205 (100‑day SMA) and $4,255 (upper Bollinger). A break above $4,075 with strong volume could signal a shift back to bullish momentum, while a fall through $3,900 would likely trigger a more aggressive correction.
- Watch U.S. Sep payrolls on 11/5/2026 for Fed rate hints
- Monitor USD/JPY and AUD/USD for further dollar weakness
- Track oil prices – higher oil supports inflation concerns and gold demand
Frequently asked questions
Why did gold jump above $4,000 after the U.S. midterm elections?
The Democratic sweep of the Senate and House on 11/3/2026 prompted expectations of fiscal gridlock, which weakened the U.S. dollar to a one‑month low. A cheaper dollar makes gold, priced in dollars, more attractive to foreign buyers, driving the metal above $4,000.
What technical levels are important for gold after the recent surge?
Resistance lies near $4,075 (20‑day Bollinger middle), $4,205 (100‑day SMA) and $4,255 (upper Bollinger). Support is centered around $3,900 (lower Bollinger). The price is still below the 20‑day and 100‑day SMAs, keeping a bearish bias in the short term.
Official data sources
Related news
- Market overview: gold spikes, pound tops Brexit level, stocks wobble after US midterms
- Gold soars 3.5% after Democrats win midterm elections
- Gold rebounds on Wednesday but stays vulnerable ahead of jobs report
- Democrats midterm victory drives dollar slide and gold rally in market overview
More from ITF
This article is compiled from international market news for information only. It is not investment advice.