Silver bears stay in control as XAG/USD makes fresh lower lows
 ITF Team3 min read
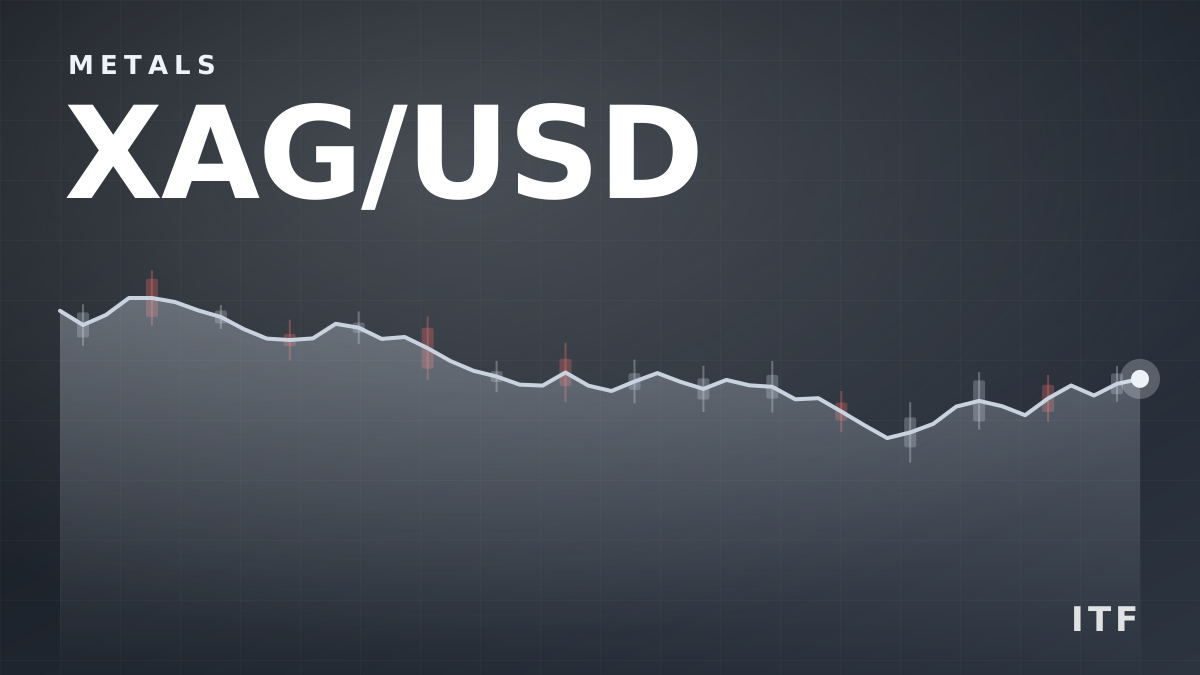
Silver (XAG/USD) fell to $47.68 on 11/16/2026, down 2.45% on the day and 5.92% over the past week, as a hawkish Fed outlook lifts the dollar and Treasury yields.
Key takeaways
- Silver fell to $47.68 on 11/16/2026, its lowest level since November 2025.
- The metal lost 5.92% in the week ending 11/16/2026 as the dollar stayed firm.
- Silver is trading below its 21‑, 50‑, 100‑ and 200‑day SMAs, reinforcing a bearish bias.
- Traders expect a Fed rate hike in December and further hikes in Q1 2027.
Silver (XAG/USD) slipped to around $47.68 on 11/16/2026, marking a 2.45% drop for the day and extending a 5.92% decline over the previous week. The move follows a sharp hawkish repricing of Federal Reserve rate expectations that has kept the U.S. dollar strong and Treasury yields elevated, leaving silver bulls on the sidelines.
Technical picture: lower highs, lower lows
On the daily chart, XAG/USD remains in a clear downtrend, forming a series of lower highs and lower lows. The price sits beneath its 21‑, 50‑, 100‑ and 200‑day simple moving averages, a confluence that reinforces the bearish bias. Immediate resistance lies near the prior low at $48.50, with the next ceiling at the recent high of $53.50. A broader resistance zone stretches from the 50‑day SMA at $58 to the 100‑day SMA at $60, while the 200‑day SMA sits near $67.
On the downside, the round $45.00 level is the next key support. A break below this threshold could open the path to a deeper correction toward $42‑$43. The Relative Strength Index hovers just above the oversold line at 30, and the MACD has turned marginally negative, suggesting that downside momentum may still have room to develop.
Why the dollar and yields matter for silver
Silver is priced in U.S. dollars, so a firmer greenback makes the metal more expensive for holders of other currencies. The recent Fed‑driven dollar strength has therefore acted as a headwind for silver. At the same time, Treasury yields have risen, raising the opportunity cost of holding a non‑yielding asset like silver. Higher yields make bonds relatively more attractive, prompting some investors to rotate out of precious metals.
Market participants have already priced in a December 2026 Fed rate hike and are looking ahead to a series of speeches from Fed officials, including New York Fed President John Williams and Fed Chair Kevin Warsh, scheduled for later on Monday. Several officials have hinted that further hikes may be needed in the first quarter of 2027 to bring inflation back to the 2% target, adding to the bearish pressure on silver.
Read also: Gold steadies after hitting lowest since October 2025
Fundamental backdrop and industrial demand
Beyond monetary policy, silver’s price is also shaped by its industrial uses. The metal’s superior electrical conductivity makes it a key input for electronics, solar panels, and other high‑tech applications. Weakness in U.S., Chinese and Indian industrial activity can dampen demand, while any resurgence in these economies could provide a floor for prices.
Investors also watch the gold‑silver ratio as a relative valuation tool. When gold rallies, silver often follows, but the ratio has widened this year as gold has held better than silver, suggesting that silver may be more vulnerable to macro headwinds.
What traders should monitor next
Key levels to watch include the $48.50 resistance, which could trigger a short‑term bounce if breached, and the $45.00 support, whose breach would signal a move toward the $42‑$43 area. On the macro side, the upcoming Fed speeches on 11/16/2026 will be crucial; any indication of a more aggressive tightening path could push the dollar higher and deepen silver’s decline.
Traders should also keep an eye on U.S. inflation data, Treasury yield movements, and any surprise in industrial demand indicators from the United States, China or India. A sudden easing of dollar strength or a dip in yields could provide the catalyst for a short‑term reversal.
- Current price: $47.68 (11/16/2026)
- Weekly loss: 5.92%
- Resistance: $48.50, $53.50, $58‑$60 zone
- Support: $45.00, then $42‑$43
- RSI: ~30, MACD: marginally negative
Frequently asked questions
Why did silver fall sharply on 11/16/2026?
Silver dropped to $47.68 on 11/16/2026 because a hawkish Fed outlook lifted the U.S. dollar and Treasury yields, raising the opportunity cost of holding a non‑yielding metal and keeping demand subdued.
What technical levels are most important for XAG/USD right now?
The most immediate resistance is near $48.50, followed by $53.50 and a broader $58‑$60 zone. On the downside, $45.00 is the key support; a break below could open the path to $42‑$43.
How could upcoming Fed speeches affect silver?
If Fed officials signal more rate hikes or a stronger stance on inflation, the dollar may stay firm and yields could rise, adding further pressure on silver. Conversely, a dovish tone could ease dollar strength and support a short‑term price bounce.
Official data sources
Related news
- Gold steadies after hitting lowest since October 2025
- Market overview: USD strength pushes EUR/USD to one‑year low, gold slides and Bitcoin dips
- Euro approaches 1.1000 area as Fed's hawkishness boosts US Dollar
- Gold near one-year low, can it hold $3,852?
More from ITF
- ITF trading signals for gold and forex
- Copy verified traders with ITF Copy Trading
- This week’s economic calendar
This article is compiled from international market news for information only. It is not investment advice.