Spot gold tests long‑term value zone after more‑than‑year low
 ITF Team3 min read
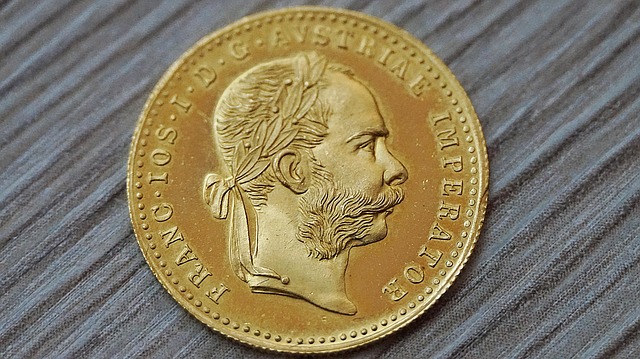
Spot gold steadied near $3,832 on Nov 17, 2026, with $3,707.82 support in focus as a strong dollar and Fed hike odds pressure the market.
Key takeaways
- Spot gold was trading around $3,871.34 on Nov 17, 2026, down 0.74%.
- The next key support level is $3,707.82, the 61.8% long‑term retracement point.
- A Federal Reserve rate hike in December 2026 is seen as almost certain, adding bearish pressure on gold.
- A break above $4,148.71 would flip the weekly swing chart to an uptrend.
Spot gold (XAU/USD) hovered near $3,871 on Nov 17, 2026, after rebounding from a more‑than‑year low of $3,832.46. The move came as the U.S. dollar index briefly eased, but the broader picture remains dominated by a strong greenback and near‑certain expectations of a Federal Reserve rate hike in December.
Price action and immediate technical picture
The price recovered modestly from the $3,832.46 low, yet the weekly and daily swing‑chart trends stay bearish. The weekly chart shows the main trend down, with the next resistance at $4,148.71. A close above that level would turn the weekly bias bullish. On the daily chart, a break above $3,832.46 would signal a continuation of the downtrend, while a fall through $3,707.82 would deepen the bearish outlook.
Technical levels from the latest FXEmpire analysis place the 61.8% long‑term retracement zone between $4,069.54 and $3,707.82. Spot gold is currently inside this corridor, which many traders view as a value‑finding area. The 50‑day moving average sits at $4,134.03, and the 52‑week moving average is near $4,442.28, both acting as resistance for any short‑term rally.
Drivers behind the price movement
The primary catalyst for the recent weakness is the U.S. dollar’s strength. A stronger dollar raises the opportunity cost of holding non‑yielding assets like gold, prompting investors to shift toward dollar‑denominated instruments. In parallel, market participants assign almost a 100% probability to a Fed rate hike in December, reversing the previous year’s expectation of rate cuts.
Higher rates increase real yields, which historically depress gold prices. The Fed’s stance also influences inflation expectations; if investors believe the central bank will keep rates elevated for an extended period, the appeal of gold as an inflation hedge may diminish, at least in the short run.
Read also: Gold finds floor as Fed rate expectations rise
Long‑term perspective and key zones
The analyst defines a long‑term range from $2,536.85 to $5,602.23, with the November 2024 low at the bottom. The current retracement zone of $4,069.54‑$3,707.82 represents roughly a 61.8% pullback of that range. A decisive break below $3,707.82 would target the next long‑term low around $3,627.96, while a move above $4,069.54 would suggest the downtrend is losing steam.
On the upside, the 52‑week moving average cluster at $4,442.28‑$4,481.78 is the most important hurdle for longer‑term bulls. Overcoming $4,481.78 would mark a 20% recovery from the all‑time high of $5,602.23 and could be interpreted as the start of a new bull market. A 20% rally from the $3,734.82 level would also land near $4,481.78, highlighting the significance of that pivot point.
What traders should watch next
Key levels to monitor this week include: a break below $3,832.46, which would put $3,707.82 in focus; a bounce above $4,069.54, indicating the first sign of trend weakening; and a decisive move through $4,148.71, which would flip the weekly swing bias to bullish.
Beyond price, traders should keep an eye on the U.S. dollar index and any Fed communication ahead of the December meeting. A surprise dovish tone could soften the pressure on gold, while continued hawkishness would likely keep the metal under pressure.
- $3,871.34 – spot gold price at 08:50 UTC, Nov 17, 2026
- $3,832.46 – recent low that defines the short‑term swing bottom
- $3,707.82 – 61.8% long‑term retracement support
- $4,069.54 – 50% long‑term retracement level
- $4,148.71 – weekly swing‑chart top that could reverse the trend
Frequently asked questions
Why is the dollar strength hurting gold prices?
A stronger U.S. dollar raises the cost of buying gold for investors holding other currencies, and it lifts real yields. Higher real yields make non‑interest‑bearing assets like gold less attractive, which pushes the price down.
What would a break above $4,148.71 mean for gold?
Crossing $4,148.71 would break the weekly swing‑chart top, changing the weekly bias from bearish to bullish and suggesting that the longer‑term downtrend may be ending.
Official data sources
Related news
- Gold finds floor as Fed rate expectations rise
- Gold volatile near term on Fed outlook
- Market overview: gold steadies, pound rebounds, bitcoin under pressure
- Gold recovers from YTD low as Fed hike bets and strong dollar cap upside
More from ITF
This article is compiled from international market news for information only. It is not investment advice.