USD/CAD trades near 1.4000 as falling wedge narrows
 ITF Team1 min read
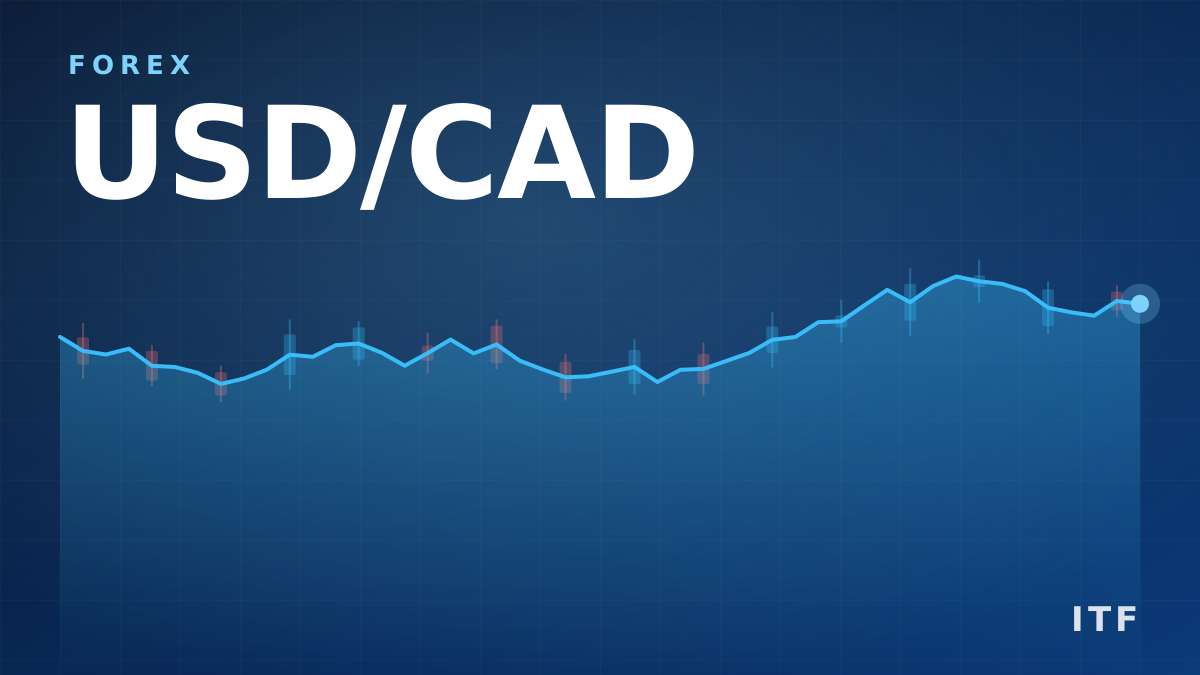
The pair steadied around 1.3990 on Thursday, with technicals hinting at a possible bullish breakout from a falling wedge.
USD/CAD stayed subdued for a second day, hovering near 1.3990 during European trading on Thursday. The daily chart shows the pair confined inside a falling‑wedge pattern, suggesting that selling pressure is weakening and a bullish breakout could be on the horizon.
Technical outlook
- The pair is still below the 9‑day EMA (1.4042) and the 50‑day EMA (1.4060), keeping a short‑term bearish bias.
- RSI sits around 39, indicating bearish momentum but not a deep oversold condition.
- FXS Fed Sentiment Index near 142 points, pointing to a softer policy backdrop that does not currently support a stronger CAD.
Key support and resistance levels
- Initial support at the lower wedge boundary around 1.3940; a break below could expose the five‑month low of 1.3732 and further support at 1.3481 (Oct 2024 low).
- Resistance cluster at the 9‑day EMA 1.4042, then the 50‑day EMA 1.4060, and the upper wedge edge near 1.4080. A clear break above may target the 18‑month high around 1.4299.
What traders are watching next
- Whether USD/CAD can breach the 1.4080 wedge ceiling for a bullish move toward 1.4299.
- Potential reaction if price slips below 1.3940, testing the 1.3732 low.
- Bank of Canada policy cues – the recent 25 bp hike to 2.50% was expected, but further tightening could revive CAD strength.
Related news
- Warsh signals higher rates but keeps Fed options open
- Ripple and Stellar fall as hawkish Fed tone pressures crypto market
- Gold weakens below $4,050 as Fed rate outlook fuels dollar demand and Iran tensions linger
- budget promises growth in every postcode amid uneven devolution plan
More from ITF
- ITF trading signals for gold and forex
- Copy verified traders with ITF Copy Trading
- This week’s economic calendar
This article is compiled from international market news for information only. It is not investment advice.