Gold faces fresh headwinds as real yields climb after US CPI
 ITF Team2 min read
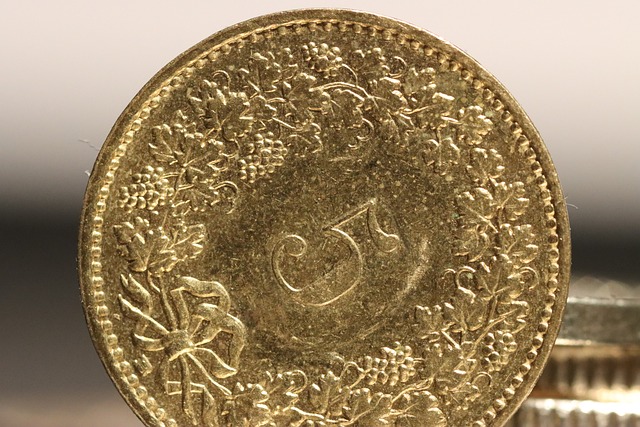
Gold slipped to $4,014.65 on Nov 11, 2026 as 5‑year real yields rose to 2.56% and core CPI held steady at 0.3%, tightening pressure on the metal.
Key takeaways
- Gold closed at $4,014.65 on Nov 11, 2026, down 3.00% from the previous close.
- U.S. 5‑year real Treasury yield rose to 2.56% on Nov 10, up from 2.35% on Nov 6.
- Core CPI for October 2026 was unchanged at 0.3% month‑over‑month.
- The technical pivot for gold is at $4,064.71, with support at $3,987.96 and resistance at $4,115.78.
Gold’s early rebound on Wednesday faded as U.S. real yields surged and core inflation stayed stubbornly high. The metal slipped to $4,014.65 on Nov 11, 2026, a 3.00% decline from the previous session, reflecting renewed selling pressure after the latest CPI release.
CPI data and the core‑inflation story
The Bureau of Labor Statistics reported that October CPI rose 0.4% month‑over‑month, down from September’s 0.6% gain. More important for gold, core CPI – which strips out food and energy – advanced 0.3%, matching the pace seen in August and September. Energy prices rose 0.7% after a 5.2% jump in September, while gasoline added 1%.
While the headline slowdown eases the narrative of runaway inflation, the unchanged core rate signals that price pressures remain entrenched. For a metal traditionally seen as an inflation hedge, a steady core number can keep demand muted because investors anticipate that the Federal Reserve may not feel compelled to tighten further.
Real Treasury yields rise sharply
The market’s focus quickly shifted from headline CPI to the reaction of real yields. The daily par real‑yield curve released for Nov 10 showed the 5‑year real yield climbing to 2.56%, the 10‑year to 2.78% and the 30‑year to 3.17%. All three were higher than the levels recorded on Nov 6 (2.35%, 2.63% and 3.07% respectively).
Higher real yields raise the opportunity cost of holding a non‑yielding asset such as gold. When inflation‑adjusted Treasury returns become more attractive, capital tends to rotate out of precious metals and into fixed‑income instruments, adding to the downward pressure on prices.
Read also: Silver support holds as yields rise on November 11, 2026
Technical picture and key levels
Technical analysis from FXEmpire placed the pivot at $4,064.71, with the first support at $3,987.96 and the first resistance at $4,115.78. Gold futures were trading near $4,051, sandwiched between a $4,000 support band and a $4,200 resistance zone, while the 200‑day EMA sat at $4,275.60, indicating a longer‑term bearish bias.
The initial rally that morning was quickly erased as sellers reclaimed the market, suggesting that any bounce is likely to be short‑lived unless real yields retreat or a geopolitical shock re‑ignites safe‑haven demand.
What traders should watch next
The next data points that could influence gold are the upcoming U.S. retail sales report and the Fed’s policy meeting later in December. A decline in real yields, a surprise dip in core inflation, or heightened geopolitical tension would be bullish for the metal. Conversely, further real‑yield hikes or continued market risk appetite would keep the downside pressure alive.
- Watch U.S. retail sales data (due Dec 1, 2026) for risk‑on/off cues
- Monitor Fed minutes for hints on future rate path
- Track real‑yield movements; a drop below 2.5% could ease pressure on gold
Frequently asked questions
Why did gold fall after the US CPI release?
Gold fell because core CPI held at 0.3% month‑over‑month, indicating persistent inflation, while real Treasury yields jumped to 2.56% for the 5‑year term. Higher real yields increase the cost of holding a non‑yielding asset, prompting investors to shift away from gold.
What are the key technical levels for gold right now?
The technical pivot is at $4,064.71, with the first support at $3,987.96 and the first resistance at $4,115.78. Gold futures are near $4,051, and the 200‑day EMA sits at $4,275.60, suggesting a bearish longer‑term trend.
Official data sources
Related news
- Silver support holds as yields rise on November 11, 2026
- Evening market overview: Fed hike fuels dollar, gold stalls under $4,050
- US dollar climbs above 102.20 as hot CPI fuels Fed hike odds
- Singapore gold vaulting service aims to boost bullion flows
More from ITF
- ITF trading signals for gold and forex
- Copy verified traders with ITF Copy Trading
- This week’s economic calendar
This article is compiled from international market news for information only. It is not investment advice.