Gold slides below $4,100 as Fed hike bets tighten market
 ITF Team3 min read
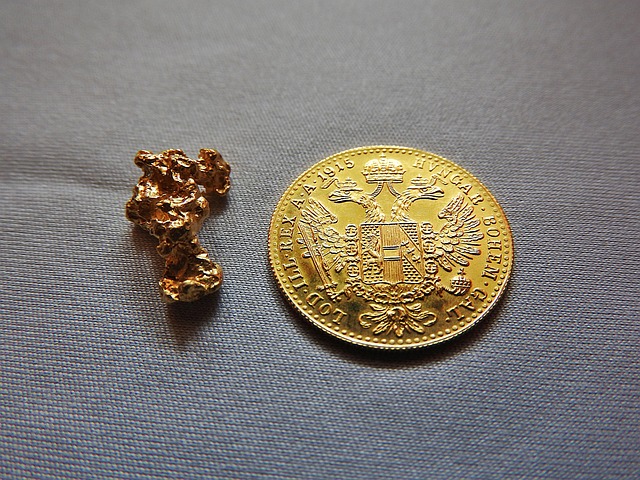
Gold fell under $4,100 on 11/10/2026 as Fed rate‑hike expectations rose, US payrolls beat forecasts and geopolitical tension lingered, setting key support at $4,103.
Key takeaways
- Gold slipped below $4,100 on 11/10/2026 during the European session.
- CME FedWatch Tool shows over 80% probability of a Fed hike in December.
- US non‑farm payrolls added 165,000 jobs in October, pushing the unemployment rate to 4.1%.
- Key technical support for XAU/USD lies at $4,103 (200‑period SMA) and $4,059 (23.6% Fibonacci).
Gold (XAU/USD) fell back under the $4,100 level on 11/10/2026 during the first half of the European session, erasing much of Monday’s rally to the $4,150 resistance. The move was driven by firmer expectations that the U.S. Federal Reserve will raise rates in December, a development that pulled capital away from the non‑yielding bullion.
Fed rate‑hike expectations dominate price action
The CME Group’s FedWatch Tool now prices an 80%+ chance of a December rate increase after a surprisingly strong U.S. jobs report. Non‑farm payrolls rose by 165,000 in October, beating the most optimistic forecasts, while the unemployment rate slipped to 4.1% and prior months were revised up by a total of 84,000. These data reinforce the view that the economy remains robust, keeping the prospect of tighter monetary policy alive.
Higher‑for‑longer rates raise real yields, which increase the opportunity cost of holding gold. As a result, traders have been shifting into the dollar and short‑term Treasury instruments, adding pressure on the precious metal despite the dollar’s own mixed signals from the Middle‑East diplomatic chatter.
Geopolitical backdrop and its limited impact on safe‑haven flows
President Donald Trump announced on 11/9/2026 that momentum toward ending the conflict with Iran was positive and that a resumption of strikes was unlikely. Iran’s Supreme National Security Council secretary, Mohsen Rezaei, dismissed the claim as fake news and reiterated Tehran’s seven conditions for a cease‑fire. The contradictory statements keep the geopolitical risk premium in play, but they have not reignited demand for the U.S. dollar as a safe‑haven, leaving gold without a clear upside catalyst.
Traders remain cautious ahead of the U.S. Consumer Price Index (CPI) release later on 11/10/2026. Core CPI, the metric the Fed watches most closely, will determine whether inflation is easing enough to temper further rate hikes. A higher‑than‑expected CPI could reinforce the 80% hike probability, while a softer reading might give the market room to reconsider the timing of the next move.
Read also: Bitcoin, ethereum, xrp decline as US CPI looms
Technical picture: support, resistance and momentum
On the 4‑hour chart, XAU/USD broke above both the 100‑period and 200‑period simple moving averages, a bullish sign that suggests the recent up‑trend still holds. Momentum indicators are modestly positive, with the RSI near 57 and the MACD just above zero. However, the price is now testing the 200‑period SMA at $4,103 and the 23.6% Fibonacci retracement at $4,059, which act as immediate support zones.
Resistance lies at the 38.2% Fibonacci level around $4,180, followed by the 50.0% retracement near $4,279 and the 61.8% level close to $4,377. Should gold break above $4,180, the next objective would be the $4,279 zone, a level that has previously acted as a ceiling during the past two months.
What traders should watch next
The primary catalyst will be the U.S. CPI data due later on 11/10/2026. A reading that confirms core inflation staying above 2% could lock in the high probability of a December hike, keeping pressure on gold. Conversely, a dip in core CPI might prompt a short‑term rally as the market reassesses the Fed’s tightening path.
In addition, any fresh developments in the Iran‑U.S. diplomatic track could shift risk sentiment. A credible de‑escalation would likely boost the dollar’s safe‑haven appeal, while renewed tension could revive gold’s traditional role as a hedge.
- Key support: $4,103 (200‑SMA) and $4,059 (23.6% Fibonacci)
- Initial resistance: $4,180 (38.2% Fibonacci)
- Next resistance levels: $4,279 (50% retracement) and $4,377 (61.8% retracement)
- Fed hike probability (Dec): >80% per CME FedWatch
Frequently asked questions
Why did gold drop below $4,100 on 11/10/2026?
The drop was mainly caused by stronger expectations that the Federal Reserve will raise rates in December, after a robust U.S. jobs report showed 165,000 new jobs in October and a unemployment rate of 4.1%. Higher‑for‑longer rates raise real yields, making gold less attractive.
How does the upcoming U.S. CPI report affect gold?
Core CPI is the Fed’s preferred inflation gauge. If the November CPI comes in above expectations, it supports the >80% probability of a December rate hike, which would keep pressure on gold. A softer CPI could reduce the hike odds and allow gold to regain some ground.
Official data sources
Related news
- Bitcoin, ethereum, xrp decline as US CPI looms
- Gold falls over 1% as hawkish Fed remarks weigh ahead of US CPI
- Market overview: gold slips, silver drops and crypto stalls ahead of US inflation data
- Bitcoin price eyes $74K as Fed rate‑hike bets hit 96% after Waller speech
More from ITF
- ITF trading signals for gold and forex
- Copy verified traders with ITF Copy Trading
- This week’s economic calendar
This article is compiled from international market news for information only. It is not investment advice.