Silver price falls to $52.51 as ratio with gold rises
 ITF Team3 min read
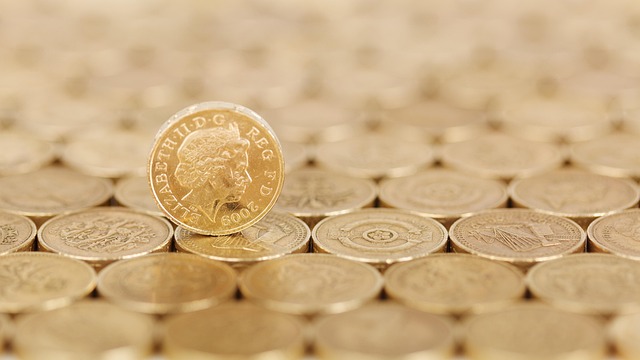
Silver slipped to $52.51 per ounce on 11/10/2026, a 1.58% drop from Monday and a 26.13% decline YTD, while the gold‑silver ratio climbed to 77.92.
Key takeaways
- Silver closed at $52.51 per ounce on 11/10/2026, down 1.58% from the previous day.
- The year‑to‑date decline in silver is 26.13% as of 11/10/2026.
- The gold‑silver ratio rose to 77.92 on 11/10/2026, up from 77.63 the day before.
Silver (XAG/USD) fell to $52.51 per troy ounce on Thursday, 11/10/2026, according to FXStreet data. The move represents a 1.58% drop from Monday’s $53.35 level and extends a broader downtrend that has seen the metal lose more than a quarter of its value since the start of the year.
Price action and immediate market reaction
The decline was swift in the Asian session, with the XAG/USD pair slipping below the $52.60 threshold and finding support near $52.40. Traders cited a stronger US dollar as a key catalyst; the greenback rallied on renewed expectations of Federal Reserve rate hikes, making a non‑yielding asset like silver less attractive.
At the same time, the gold‑silver ratio – the number of ounces of silver needed to match one ounce of gold – rose to 77.92, up from 77.63 the previous day. A higher ratio suggests that gold is outperforming silver, reinforcing the view that investors are favouring the more traditional safe‑haven.
Fundamental drivers behind the slide
Silver’s price is influenced by a mix of macro‑economic and sector‑specific factors. The metal’s safe‑haven appeal is weaker than gold’s, so a firmer dollar and higher real yields tend to suppress demand. With the Fed’s December rate‑hike bets gaining traction, market participants anticipate tighter monetary conditions, which pressurises yield‑less assets.
Industrial demand also matters. Silver is heavily used in electronics, solar panels and other high‑conductivity applications. Recent data from the United States, China and India – the three biggest industrial consumers – have shown mixed signals, with a modest slowdown in US manufacturing and a tentative recovery in China’s solar sector. These trends have muted the bullish industrial backdrop that sometimes cushions silver’s price.
Read also: Silver XAG/USD correction nears potential turning point
Technical context and key levels
From a chart perspective, the metal broke below its 20‑day moving average around $52.70, a level that had acted as support throughout July and August. The next major psychological barrier lies at $51.00, a round number that has historically attracted buying interest. On the upside, the recent high of $53.80 from early September remains a short‑term resistance point.
The broader year‑to‑date decline of 26.13% places silver well below its 2025 peak of $68.20, highlighting the magnitude of the correction. Traders monitoring the gold‑silver ratio will watch for a pull‑back toward 75.00, a level that historically precedes a relative rally in silver.
Implications for traders and outlook
For market participants, the current environment underscores the importance of dollar dynamics and real‑yield expectations. A continued rally in the US dollar or further Fed tightening could keep pressure on silver, while any softening of inflation data or a dovish shift in policy may revive interest.
Investors also keep an eye on upcoming US CPI data scheduled for 11/14/2026, which could reshape expectations for future rate moves. A surprise drop in inflation could weaken the dollar and provide a tailwind for silver, whereas a higher‑than‑expected reading would likely reinforce the current downtrend.
- Current price: $52.51 per ounce (11/10/2026)
- YTD change: -26.13%
- Gold‑silver ratio: 77.92
- Key support: $52.40; next major support: $51.00
- Key resistance: $53.80
Frequently asked questions
Why did silver fall on 11/10/2026?
Silver dropped to $52.51 on 11/10/2026 because the US dollar strengthened amid growing expectations of a December Federal Reserve rate hike, making the non‑yielding metal less appealing. The move also coincided with a break below the 20‑day moving average, adding technical pressure.
What does the gold‑silver ratio indicate?
The gold‑silver ratio rose to 77.92 on 11/10/2026, up from 77.63 the day before. A higher ratio means gold is outperforming silver, suggesting that investors view gold as the preferred safe‑haven and that silver may be relatively undervalued if the ratio later falls.
Official data sources
Related news
- Silver XAG/USD correction nears potential turning point
- Copper price forecast: tight China supply lifts to $6.44
- Gold price stalls near $4,148 ahead of US CPI release
- Silver price nears $53 as oil falls and inflation pressure eases
More from ITF
This article is compiled from international market news for information only. It is not investment advice.