Silver price falls as US CPI tops expectations
 ITF Team3 min read
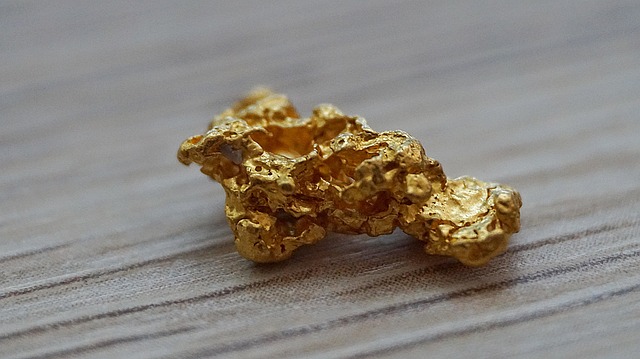
Silver (XAG/USD) slipped to $51.23 on 11/9/2026, down 3.97% after US CPI rose 0.4% MoM, boosting the dollar and Treasury yields.
Key takeaways
- Silver fell to $51.23 on 11/9/2026, a 3.97% daily drop.
- US CPI rose 0.4% month‑over‑month in October, above the 0.3% forecast.
- The CME FedWatch Tool shows an 89.2% probability of a 25‑bps Fed hike in December.
- Immediate technical support for XAG/USD sits near $50, with resistance at $54 and $55.
Silver (XAG/USD) dropped sharply on Tuesday, 11/9/2026, sliding to around $51.23 and losing 3.97% on the day. The move was triggered by a hotter‑than‑expected US Consumer Price Index, which lifted the US dollar and pushed Treasury yields higher, making non‑yielding precious metals less attractive.
Inflation data fuels dollar strength and yields
The US CPI for October increased 0.4% month‑over‑month, beating the 0.3% consensus but still below September’s 0.6% rise. Core CPI, which strips out food and energy, rose 0.3%, matching September and outpacing the 0.2% forecast. The surprise in headline inflation prompted traders to bid the dollar higher and Treasury yields up, both of which weigh on silver.
Dallas Fed President Lorie Logan reinforced the hawkish tone, saying the Federal Reserve needs at least two more 25‑basis‑point hikes and could move faster this winter. Earlier, Fed Governor Christopher Waller warned that a half‑point hike in December was possible if core CPI stayed around 0.3% or higher. These comments tightened market expectations for further tightening.
Market pricing of the December Fed move
The CME FedWatch Tool now reflects an 89.2% probability of a 25‑bps rate increase in December, with a 10.8% chance of a larger 50‑bps hike. Higher rates raise the opportunity cost of holding a non‑yielding asset like silver, reinforcing the sell‑off triggered by the CPI surprise.
Higher US Treasury yields also make the dollar more attractive relative to silver. As yields climb, investors often rotate into yield‑bearing assets, leaving precious metals on the back foot. The combination of a stronger greenback and rising yields created a perfect storm for XAG/USD.
Read also: EUR/USD struggles as Fed hike bets lift dollar
Technical picture: bearish bias with limited upside
On the daily chart, silver is trapped below its 21‑day, 100‑day and 200‑day simple moving averages, confirming a clear bearish bias. The Relative Strength Index sits near 38, indicating weak momentum, while the MACD has turned marginally positive, suggesting only a tentative attempt at stabilization rather than a genuine reversal.
Key support levels are clustered around $50 and the year‑to‑date low of $48.62. A break below $50 could open the path to deeper losses. On the upside, the first resistance is the 21‑day SMA near $54, followed by a horizontal barrier at $55. Higher resistance zones sit at the 100‑day SMA $60.50, the $65 level and the 200‑day SMA around $68.60, forming a broad supply zone that would need to be cleared for a sustained rally.
Implications for traders and what to watch
The current environment suggests that any further upside for silver will require a shift in the narrative—either a softer CPI reading, dovish Fed comments, or a pullback in Treasury yields. Until then, the metal is likely to remain under pressure, testing the $50 support area.
Traders should monitor upcoming US data releases, such as the November CPI and the Fed’s December policy meeting, for clues on the direction of rates. Additionally, movements in the dollar index and US Treasury yields will continue to influence silver’s price trajectory.
- US CPI October: +0.4% MoM (vs. 0.3% forecast)
- Core CPI October: +0.3% MoM (vs. 0.2% forecast)
- FedWatch December hike probability: 89.2% for 25 bps
- Current XAG/USD price: $51.23 (‑3.97% on 11/9/2026)
Frequently asked questions
Why did silver fall after the US CPI release?
The October CPI rose 0.4% month‑over‑month, above expectations, which lifted the US dollar and Treasury yields. Higher yields increase the opportunity cost of holding non‑yielding assets like silver, prompting a 3.97% drop to $51.23 on 11/9/2026.
What are the key technical levels for XAG/USD right now?
Silver is trading below its 21‑day, 100‑day and 200‑day SMAs, with immediate support near $50 and the YTD low $48.62. Resistance lies at $54 (21‑day SMA), $55, $60.50 (100‑day SMA), $65 and $68.60 (200‑day SMA).
Official data sources
Related news
- EUR/USD struggles as Fed hike bets lift dollar
- GBP/USD edges higher as Iran diplomacy hopes curb US dollar rally
- Bitcoin slides toward $73,000 after hot US CPI sparks $700 million liquidations
- Gold falls 3% as US CPI fuels Fed hike expectations
More from ITF
- ITF trading signals for gold and forex
- Copy verified traders with ITF Copy Trading
- This week’s economic calendar
This article is compiled from international market news for information only. It is not investment advice.